Near the end of every year, I like to do statistical analysis to prepare for the approaching first quarter. The most important spreadsheet I generate consists of recent average ranges and benchmark or long-term ranges for stocks, ETFs and commodities. Most charting platforms have the ATR (Average True Range) indicator. ATRs are valuable because they improve our ability to set profit targets and define risk over various time frames. Furthermore, a comparison of near-term ranges against long-term benchmarks can be used to determine if volatility is rich or cheap. In addition, ATR can be used to gauge if a market is ready to begin a trend or identify when a market is overbought/oversold.
Timing the Onset of a Trend or the End of One
One reason for comparing historic and current data is to identify trend potential. When recent day and week ranges are far below the benchmark (long-term average), odds increase for a breakout or onset of a trend. Under these circumstances buying options or executing debit spreads tend to be more effective strategies. On the other hand, when recent ranges are far above the long-term standard, a consolidation phase typically follows. Thus, selling premium or executing credit spreads may be a better approach.
Set Targets
Once a trend or breakout begins, we need to project how far the market will travel and how long it will take. I frequently use ATRs to set targets over various time frames. This is especially useful when a market advances into uncharted territory. For example, assume a market has been in a tight range for 5 sessions. Let us also assume volume and day ranges are below average. During such consolidation phases the opens and closes tend to be near each other. Under these conditions sharp vertical movements often commence.
Here are some basic rules for setting profit targets. Once the direction of a breakout is identified, the next step after entering a position is to set risk, then project profit targets using ATR. The first target may be the length of an average day. Target 2 could be the length of an average week, while an average month range may be target three. Or you can use a percentage of ATRs to define profit targets and risk. After entering a position, I prefer to set the risk at 50% of an average day range.
Determine Overbought/Oversold
ATRs are helpful when determining if a market has moved too far too fast. Otherwise known and overbought or oversold. For example, if a market moves the length of an average month over 5- or 6-days odds favor a consolidation phase. Thus, a countertrading strategy may apply. This method is a good framework to begin with. I use many variations (percentages) of this technique when testing theory.
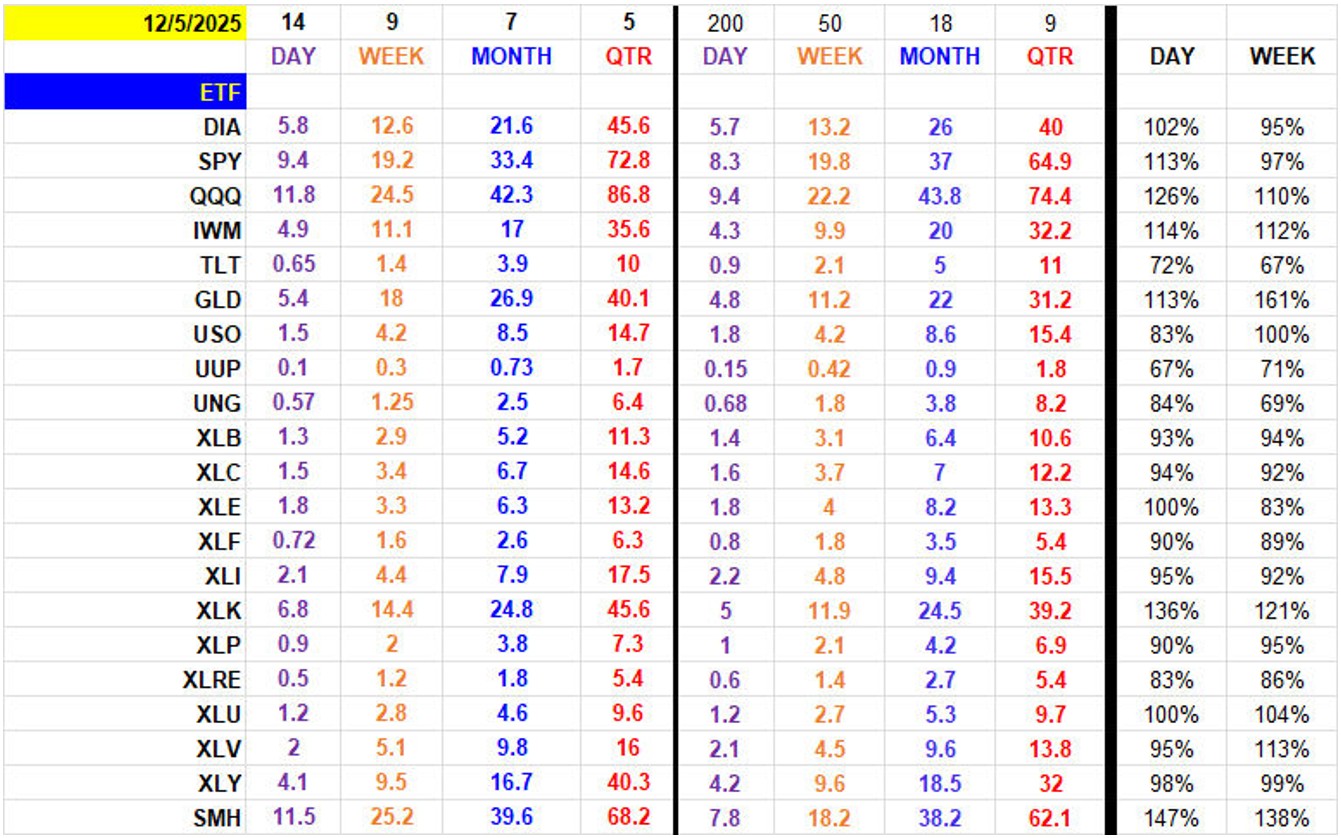
The ATRs I prefer for comparisons are:
- 14 days vs. 200
- 9 weeks vs. 50
- 7 months vs. 18
- 5 quarters vs. 9
Find time for research to create your own spreadsheet that consists of average ranges for your favorite stocks or commodities. A good trader prepares and has pertinent data available to set risk and profit targets immediately after a long or short position is taken. Below is my spreadsheet of ATRs and the comparisons for some popular ETFs.
John Seguin
Senior Technical Analyst
Market Taker Mentoring
