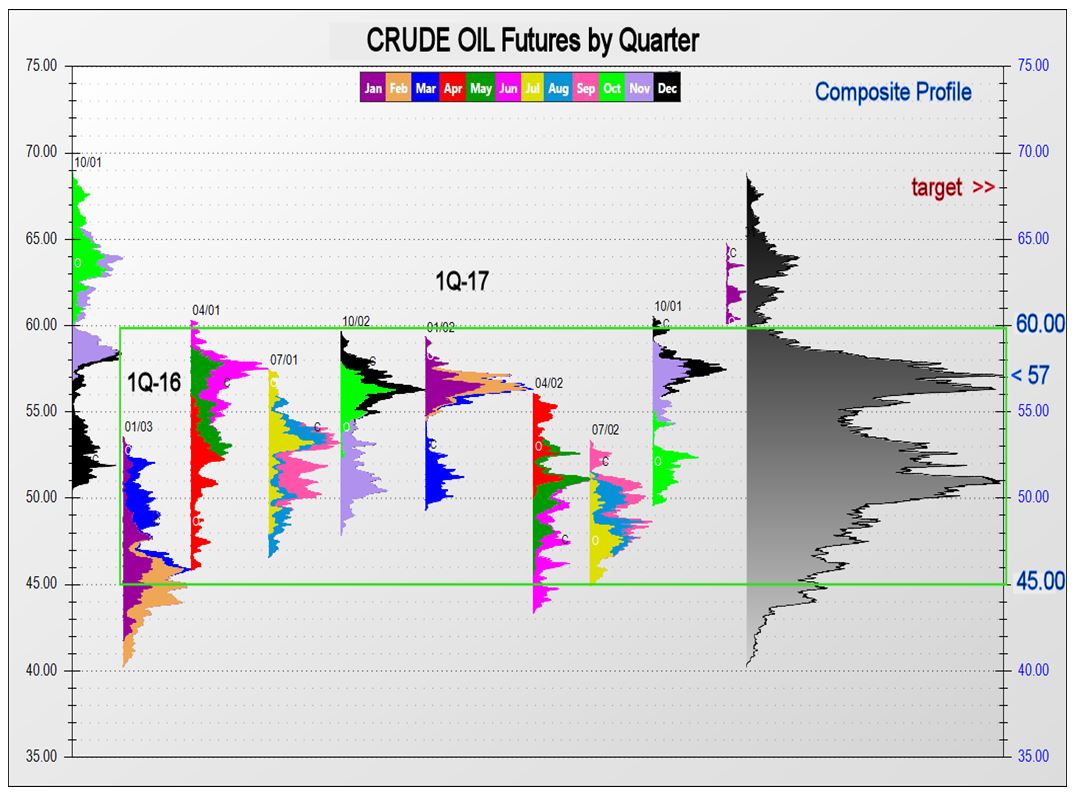
Just a few years ago crude oil was going for about $120 a barrel. Then in late 2014 oil prices began a histrionic decline. Before all was said and done, oil dropped $80 over the next 16 months. The bottom formed in early 2016 and for the next 22 months we saw choppy trend trade. During that almost 2-year period the majority of trade occurred within $45 and $60. The equivalent range for USO (Oil ETF) is approximately $9 to $12.
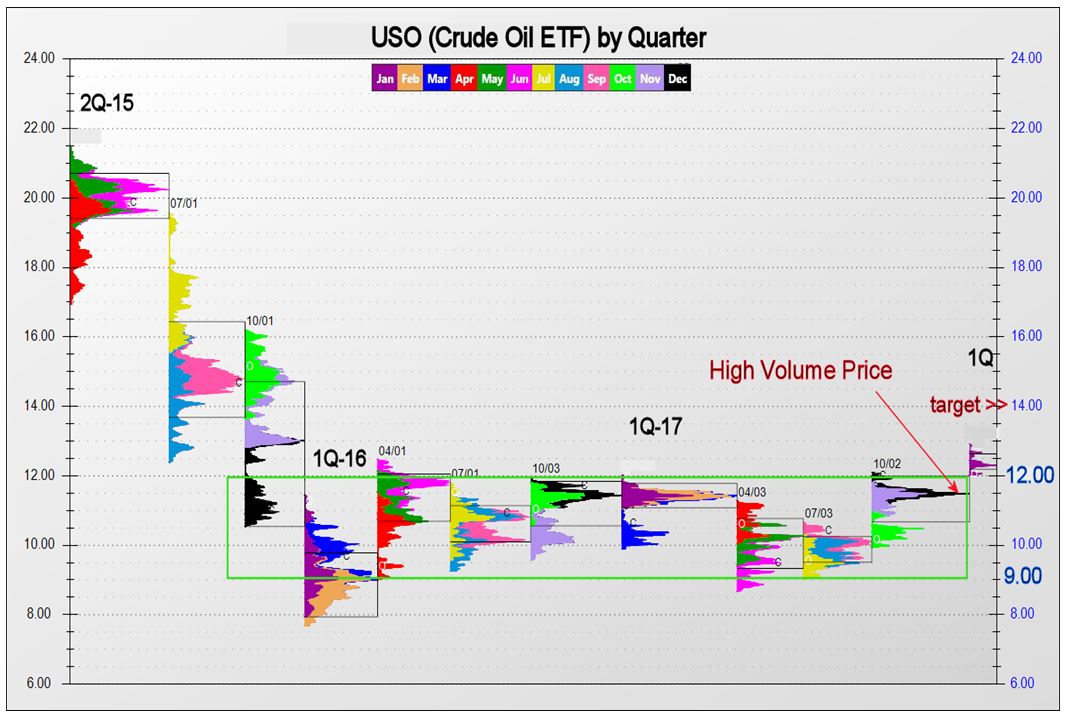
As 2017 drew to a close, oil was bumping up against the upper band of that long-term trading range. An escape to higher levels started in the new year. The quarterly USO chart below illustrates the consolidation period and the ensuing breakout.
The burning question is, how high will oil prices climb after months of pent-up energy was released? One method of projecting how far this market is apt to travel is to refer to the fairest price and measure the length of an average quarter away from it.
The high volume or fair price for USO is roughly 11.50. An average quarter range spans 2.50. Thus, we can project a move of about 14.00 in the first quarter. To retain the positive momentum, it is imperative that USO stay above 12, which is the upper band of the long-term trading range.
The corresponding levels for crude oil futures (CLG8) are as follows. The fair price is $57. An average quarter range is approximately $11. Therefore, the target for Q1 is $68. A close below $60 would negate the positive momentum and neutralize the trend.
John Seguin
Senior Futures Instructor
Market Taker Mentoring, Inc.
