Here is a really short blog about putting the odds on your side as a trader. You have heard me talk about this many times but it needs to be repeated often. What has a better chance of happening? Do you ask yourself that enough when looking at charts? If you don’t, then why not?
QQQ Chart
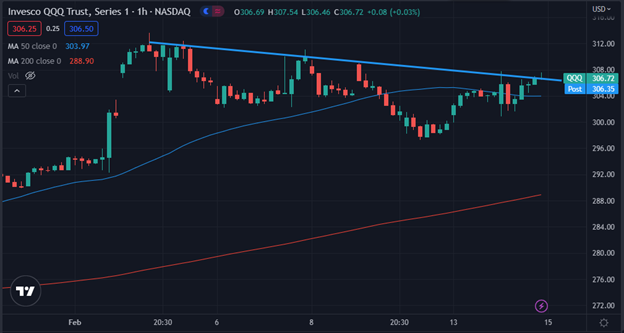
Below is a recent hourly chart of the Invesco QQQ. Take a look at the downward sloping trendline that has acted as resistance since almost the beginning of February. Based on where QQQ closed recently and considering potential resistance, you would probably say it has a better chance to move lower than higher. Resistance like support has a better chance of not letting the underlying through that level.
Break of Resistance
That said, the market has been gapping practically every single session so a gap lower or higher might occur. A gap higher over that potential resistance level from the trendline would be a bullish sign, so a trader might consider potential bullish opportunities like a long call, bull call or bull put spread. If potential resistance holds, long puts, bear puts or bear calls could be explored.
The Bottom Line
As a trader who uses technical analysis, you have to respect the fact that support and resistance have a better chance to keep the underlying from moving through that level. Again, what has a better chance of happening? But a gap or move through that level is a strong sign in the continued direction with the odds on your side too.
John Kmiecik
Senior Options Instructor
Market Taker Mentoring, Inc.
