Technical analysis can be a big part of your potential success even as an option trader. I truly believe this and talk about technical analysis every single day in my Group Coaching class. A lot of my education focuses on support and resistance. Often a stock needs to move above resistance (if there is any) to make an extended move higher. Since we are talking about bullish bases here, that is one element to make note of. But there is a potential support element that needs to be considered as well. Let’s take a look below.
What Are Bullish Bases?
There are several definitions of bullish bases, but the one I use most frequently really explains how the base forms. A bullish base forms when an underlying moves considerably higher, usually over a short period of time, and then begins to trade sideways. To me, the question becomes, what is sideways and what represents potential support? If the underlying does not pull back more than two-thirds of the move higher, it can be considered a bullish base. In essence, that two-thirds hold acts as potential support as it keeps the underlying from moving lower. For example, if a stock moves from $90 to $105 and then trades sideways and never closes convincingly below $100 (15 (move higher) X 2/3), it has formed a potential bullish base. But at the same time, the stock is stuck under some resistance that it has had trouble trading above, maybe at the $105 level in this example.
It is really showing how strong the buyers are for the particular underlying. This in itself does not guarantee the underlying will move higher. What a trader still wants to see is for the stock to break out above the resistance level of the bullish base. The base sets the tone, but buyers need to continue to push the underlying higher for a bullish directional opportunity.
Examples of Bullish Bases
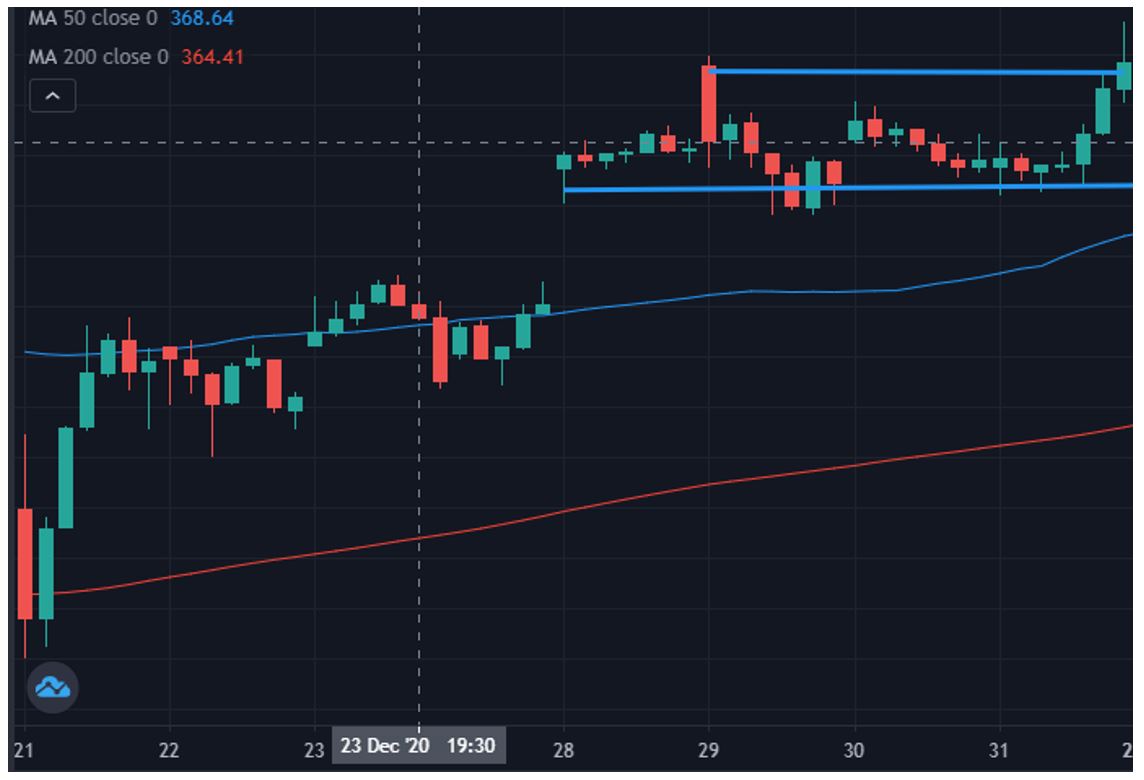
Let’s consider a couple of examples below on two different time frames. As with most technical setups, bullish bases can be seen on all different time frames. Take a look below at this potential bullish base on an hourly time frame.

The stock rallied from around $363 about 10 days ago and has traded in a range between about $371 and $374 for the past several days. This would be considered a potential bullish base since the stock did not pull back more than a third of its approximately $11 run higher. But just because it set up the potential bullish base does not mean it will move higher as seen below when the chart is extended several more time frames.

The stock gave two head fakes over resistance before retreating lower. Option traders should consider waiting for a concrete break of that potential resistance before entering a bullish trade.
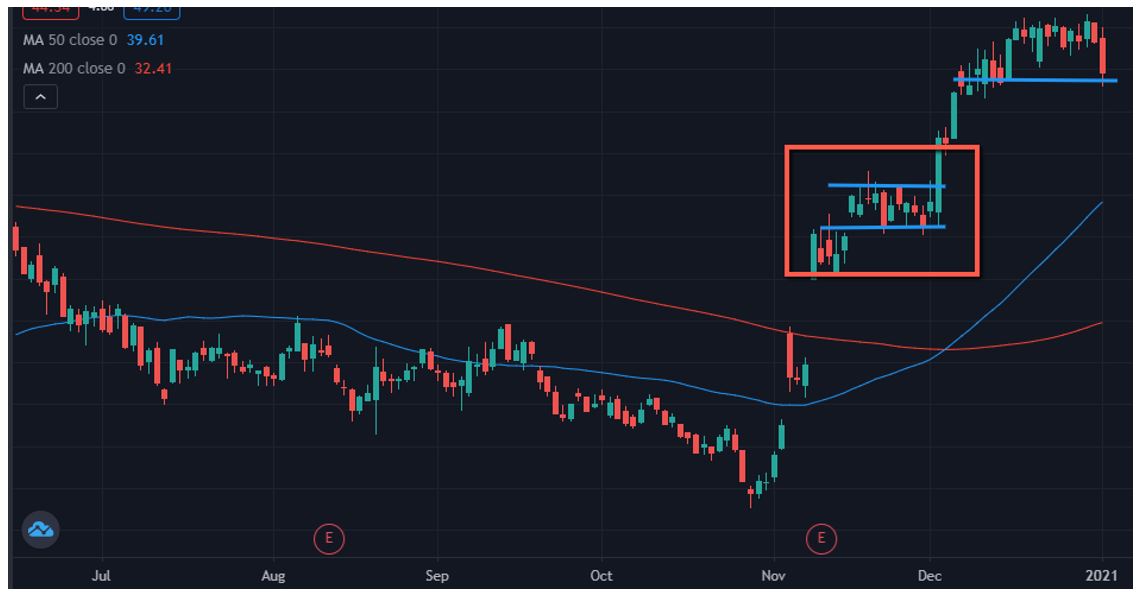
Take a look at the example below using a daily time frame. The red square is the initial bullish base.

Notice the stock moved higher only after a solid bullish candle convincingly moved through the resistance level. This would have been a bullish directional opportunity for an option trader. At the time of this screenshot, the stock was setting up another potential bullish base but resistance had not yet been broken. Patience and opportunity are key.
Finally
Determining what a bullish base is can be fairly easy if you know what to look for and consider. Remember, you want the stock to maintain two-thirds of the move higher. But just because it is a bullish base does not mean it will eventually move higher. Resistance like support (which holds up the bullish base) still has a better chance to keep the stock from moving higher. As traders we always want to put the odds on our side. For me, that would be a break above the resistance level particularly when it forms a bullish base.
John Kmiecik
Senior Options Instructor
Market Taker Mentoring, Inc.


