Support and resistance are levels on a chart that tend to keep the underlying from moving through those levels. Support keeps the underlying from moving lower and resistance keeps the underlying from moving higher. Generally, two or more levels can be potential support and resistance but sometimes once is enough like a recent pivot high or low.
It is really the trader’s interpretation as to what support and resistance are. Traders will often compare the bodies of candles (when using a chart with candlesticks), the wicks and somewhere in between to connect as many significant areas as possible. In addition, moving averages often act as support and resistance areas, and they are already drawn for a trader.
The key is to remember that it is an art and not a science. The more you practice getting better and drawing potential support and resistance lines, the more comfortable you will get. There are many ways to draw support and resistance levels. Trending up, trending down and horizontally may be the easiest to draw and identify at first for many traders. And keep in mind that there are potential support and resistance areas on all time frames and not just on daily charts.
Horizontal Support and Resistance
Support and resistance levels are horizontal if the levels of highs or lows form horizontal levels on the chart. Many charting platforms will have a setting for a horizontal line. Drawing a horizontal line and then moving it around the chart can make identifying potential horizontal support and resistance levels that much easier. Many times, these will be multiple pivot highs for horizontal resistance or multiple pivot lows for horizontal support. Again, these areas can be pivot highs or lows, bodies of the candles or wicks. Often, it is a combination of all of them as we will see below.
Support and Resistance Chart Examples
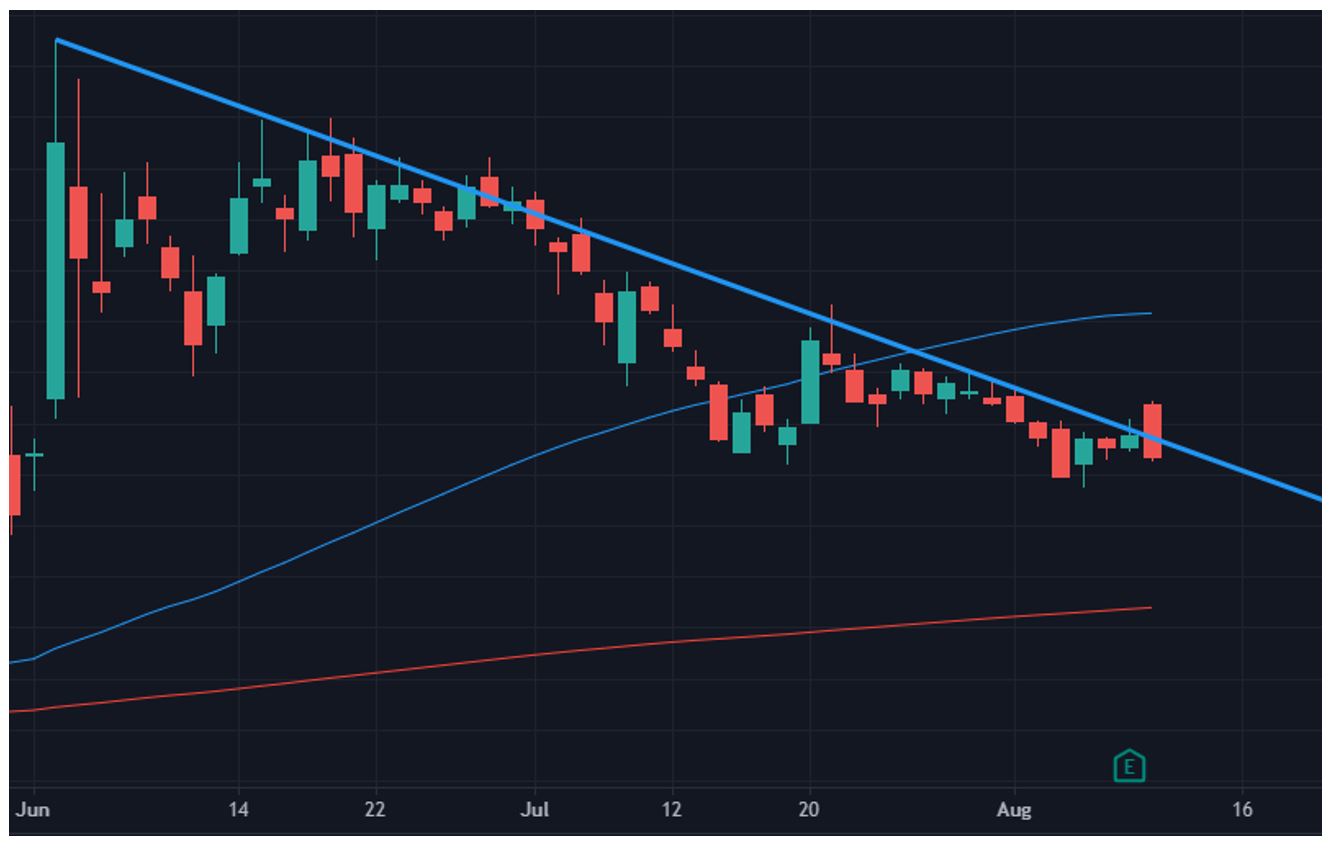
Here are a few examples to give you an idea on how support and resistance levels are drawn and used. In the first example below, you see a daily chart with a downward sloping resistance level that the underlying has not been able to move through convincingly. As traders, we need to consider what has a better chance of happening? In this case, it’s that the underlying will not move through that potential resistance area.

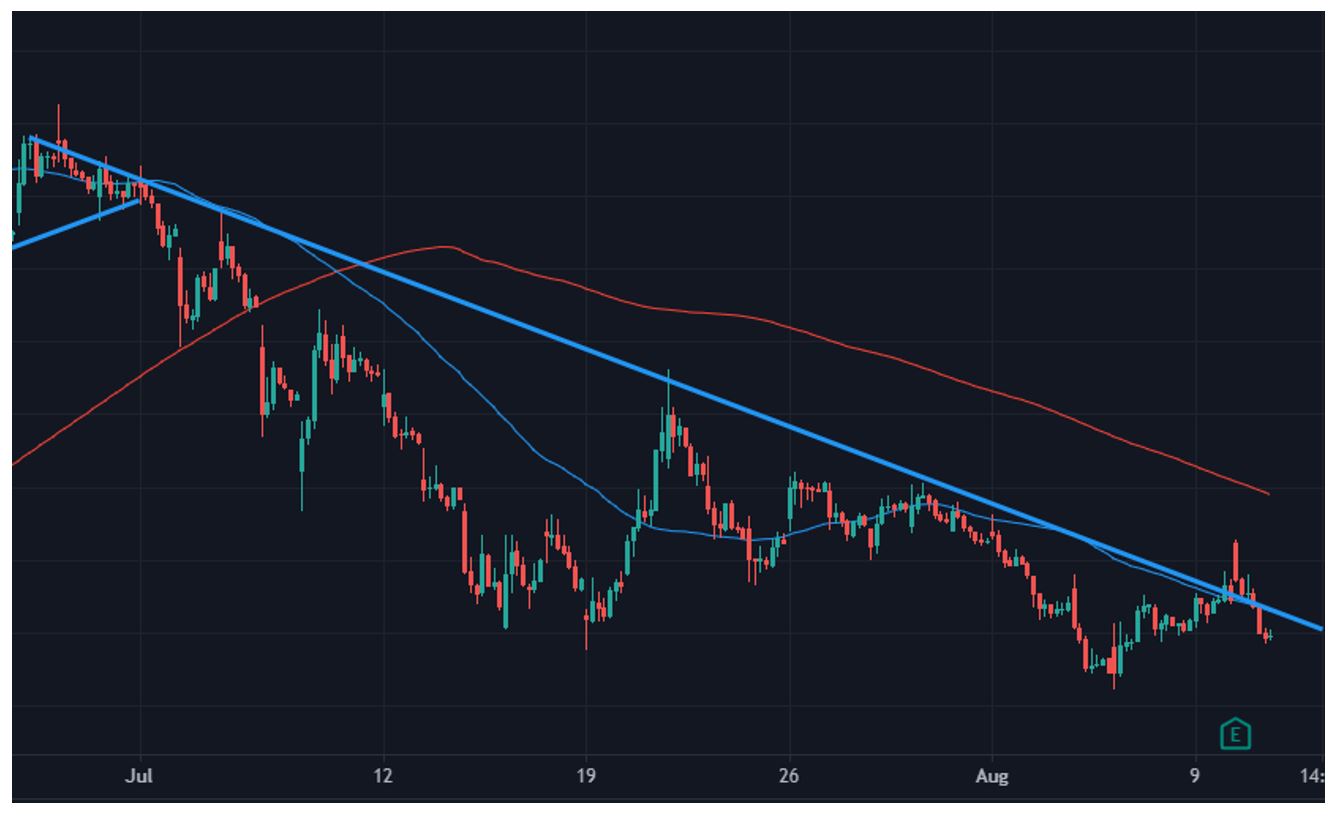
The second example below is the same underlying but now on an hourly chart. As you can see, it looks essentially the same, but it may allow a trader to enter or manage a potential trade a little earlier or more efficiently based a smaller time frame.

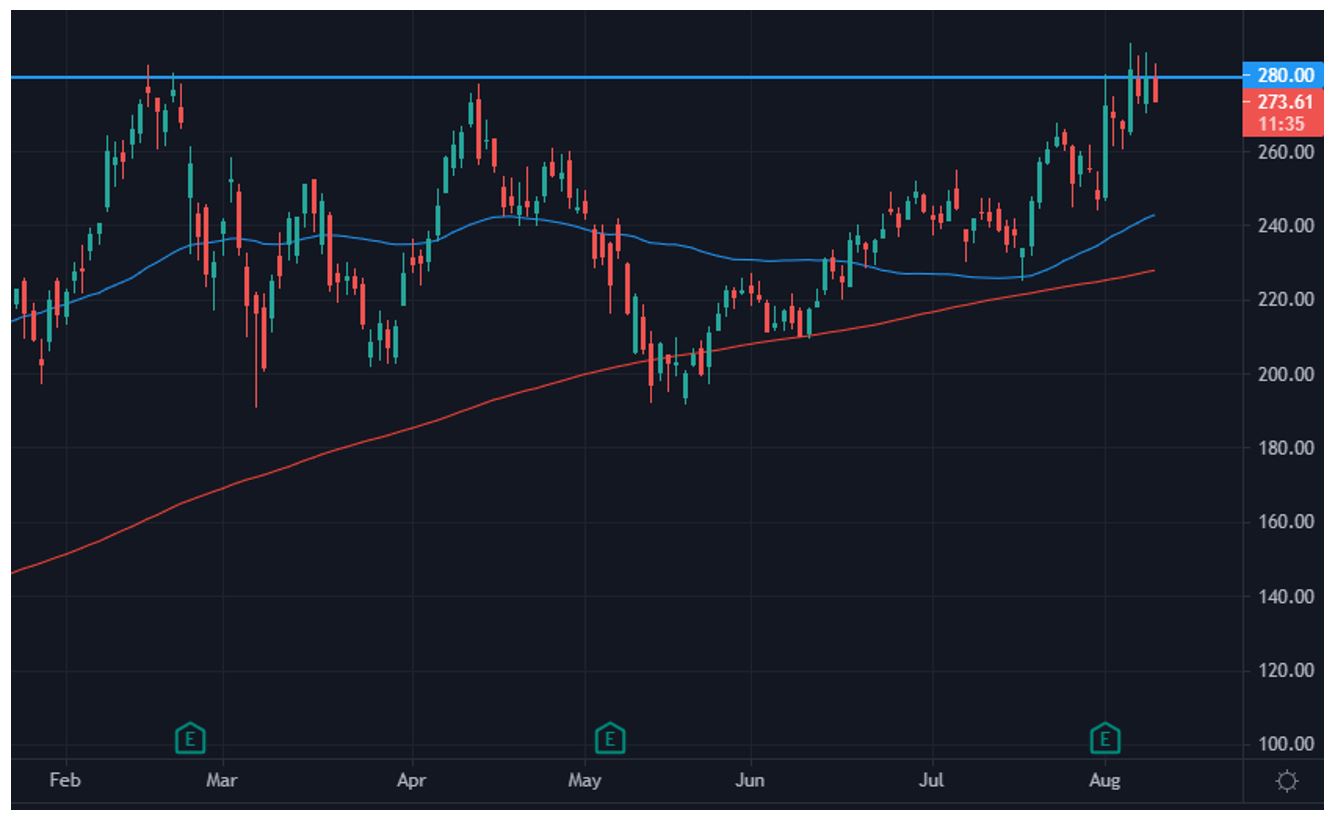
The next two charts feature potential resistance and support on daily charts. The first chart below shows potential horizontal resistance as the underlying continues to struggle to move through the $280 level. Notice how many areas on the different candlesticks the potential resistance level comes into contact with, but they all work well together to form the potential resistance.

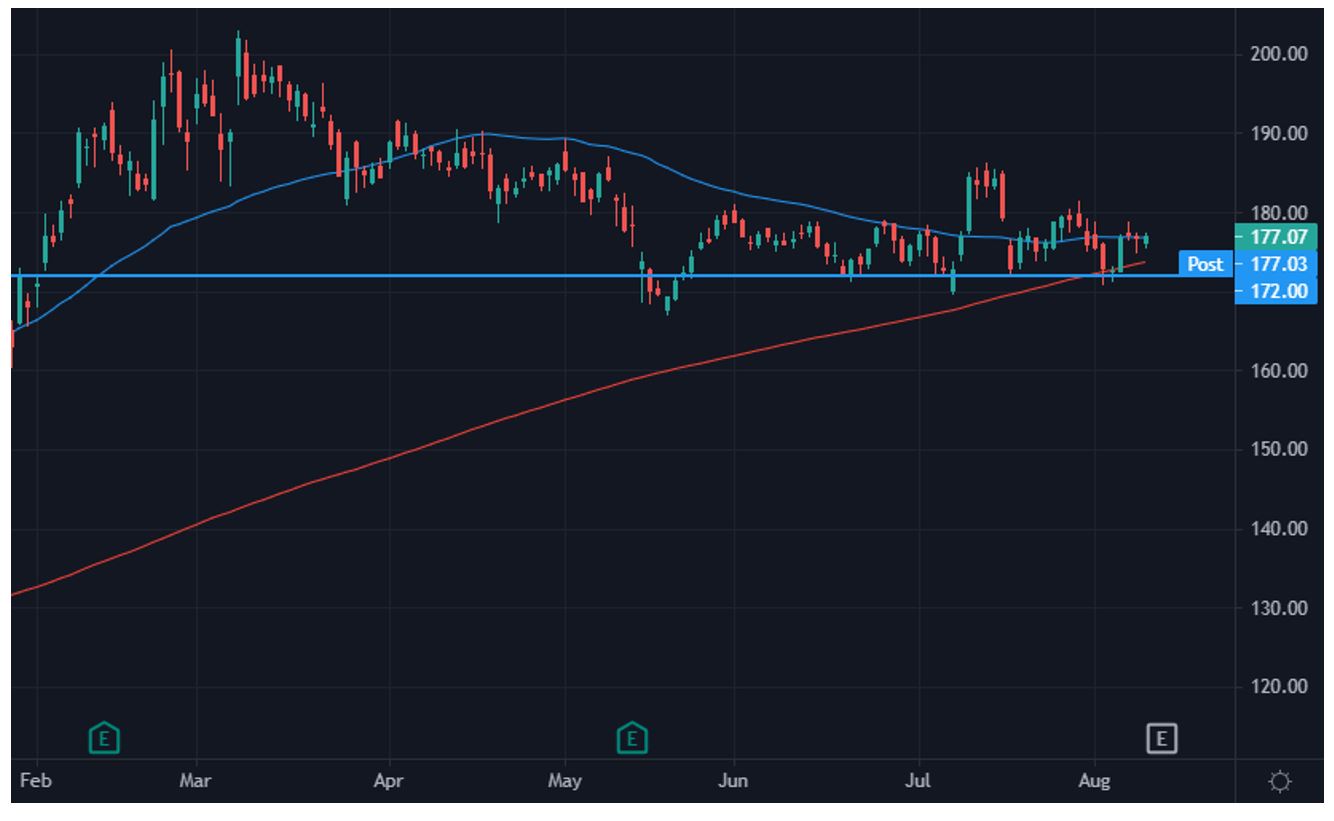
The chart below shows potential support at the $172 level. Notice how many times that area was “tested” and turned away, with the level once again being connected by the wicks and bodies of the candlesticks.

How to Use Support and Resistance to Gauge the Market
From the last two examples, a trader can determine that when resistance was challenged, sellers stepped up and either moved the underlying lower or did not let it move any higher. You might say the underlying was overbought and needed to retrace.
When support was challenged, buyers stepped up and either moved the underlying higher or did not let it move any lower. You could say this was an oversold condition and the underlying was destined to rally.
Many technical traders will use potential support and resistance levels to identify how the individual equities or the market will react going forward with probability on their side. What has a better chance of happening? This question is often answered because of support and resistance.
Final Thoughts
Support and resistance can be an integral part of technical analysis, which is one of the means we as traders use to put the odds on our side for a greater chance of profiting. The general premise is that support and resistance have better odds of holding back the underlying from moving through a level than of being broken. If you keep this in mind as a trader, you can increase your odds for success. While many traders just focus on the daily chart, there are many opportunities on smaller time frames too.
John Kmiecik
Senior Options Instructor
Market Taker Mentoring, Inc.


