Before we even think about thinking about how to measure options liquidity, we need to talk about what option liquidity is. Liquidity is a term traders love to throw around, but SO MANY traders don’t fully grasp the concept. They look up online how to measure it and often get some bad guidance that doesn’t help at all. Here’s the skinny on what options liquidity actually is.
What Is Options Liquidity?
Simply put, liquidity is how much buying or selling pressure an option can absorb without changing the price. (And if you’re a person who likes to reference definitions, keep a link to this handy. The stuff that comes up online when you google it ranges from convoluted to just plain wrong.)
Say you’re looking at this market here…

…liquidity means (in its purest definition), “Can I buy the number of calls I want at the current offer price of 3.40?”
How to Measure Options Liquidity
There’s really an easy answer to that most basic question of liquidity: Look at the size of the offer. See here…
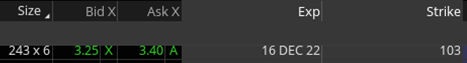
I always have the “Size” column in my option chain for that reason. The “243” is how many calls are bid at 3.25 and the “6” is how many are offered at 3.40. So, if you want to buy 6 or fewer calls at 3.40, you can. If you want to buy more than 6, you can’t.
Now that is actually a bit of an oversimplification. And it doesn’t really get to the heart of some other questions we may have on the topic. Firstly, if you try to buy 7 calls at 3.40, the fact is, most of the time, you’re going to get filled. That’s because in the poker game that is option trading, the liquidity providers (a.k.a. market makers) don’t want to show their hands. They program their quote disseminating machines to generate bids and offers and show a size they are willing to buy or sell there; but there’s also “the real market,” which is usually tighter and in greater size (deeper).
So, another reason we talk about liquidity is to develop expectations as to how likely we are to get filled at a better price by “middling the market”—meaning trade somewhere between the bid and the ask—essentially finding the “real” bid and/or offer. So how do we extract that information from the data that are available?
First, it’s important to understand what goes into how those markets are made. And there’s a lot to it. An old colleague of mine used to say, “Hotdogs, laws and options markets: You don’t want to see how any of those things are made!”
But a lot has to do with the likelihood of the market maker to be able to “get out” of the trade, once he or she gets into it because, remember, they are buying the bid and selling the offer. They basically have to wait for someone to come into the market and hit their bid or take their offer. The don’t act; they react. That’s why they like to keep the size they show to the public small. If they take on enough risk by selling at 3.40, they want to be able to raise their bid (to attract sellers so they can buy them back more easily) and their offer (so if they take on more risk by selling more of those calls, they are compensated more for the added risk).
That said, the more trading that happens in a particular class of options (meaning options listed on the same stock), the bigger market makers are willing to trade and the more likely they are to cut their markets and trade between their disseminated bid-ask spread. So, how do we know how much trading goes on in a stock’s options? Look at volume and open interest.
How to Use Volume and Open Interest
Volume is the number of contracts that has traded thus far today. It starts at zero every day and goes up as more trades occur (buys or sells). Open interest is the number of contracts that have been opened. So, if that option has never traded before and someone buys 10 (from the market maker) volume is 10 and open interest is now 10. But if someone else later that day sells, say, 2 of them to the same market maker (who is short the 10 he sold earlier) volume goes up to 12, but open interest stays at 10, because the market maker just bought them from someone else who is now short them—10 still exist. (It’s tricky. But if you just keep in mind open interest is how many options exist right now, you’ll do fine.)
I also like to keep volume and open interest in my option chain. See the more expanded version of this option’s data here…

As we can see, 217 of these traded today. To date, 638 have been created. That’s not a ton; but it’s a fair amount. If these numbers were close to zero, the real markets would be wide and not very “deep”—meaning not a lot on the bid or offer. If these numbers are in the thousands, it’s likely you’ll be able to buy or sell a lot more than what is shown and probably buy a little lower than the disseminated offer (or sell a little above the bid)—i.e., the real market is deeper and tighter.
It's important to note volume and open interest are not the same as liquidity. They are a way to infer information about liquidity. Sort of like looking at the weather app instead of just walking outside to see how the temperature feels. But between looking at the disseminated width and size, and then the volume and open interest figures, you should have a great way to make realistic assumptions on your likelihood of what price you can get filled.
Trade Smart,
Dan
